As most of you know, Sharell and I did the 23andMe genetic test. We did it before the FDA shut down their ability to give health-related reports on genetic samples, so that was fun! But one of the other great parts about 23andMe is that you can actually download the raw output data that their analysis generates. With this data in hand, you can then run additional analyses with other services. So we took mine and Sharell’s data, and used some of the analyses on a free ancestry-related website called GEDMatch.
One of the more interesting tests you can run are the admixture tests, which attempt to describe what portions of a person’s genetic background come from where. Keep in mind that by just looking at raw genetic data, we can only discern ancestry in broad terms–DNA unfortunately doesn’t have little flags on it if you look at it really close with a microscope.
Here are some pie charts that describe each of our deep genetic ancestries.
Casey:
Sharell:
You can see that both Sharell and I have large “North Sea” and “Atlantic” ancestries. What does that even mean? Today’s political borders are not really helpful, since genetics is more of a consequence of older migrations of people. A slightly better way to think about it might be using linguistic groups. The North Sea group, for example, is predominately peoples who speak North and West Germanic languages. This includes the English, Dutch, Germans, and Scandinavians (Danes, Norwegians, Swedes, Icelanders). The Atlantic group are peoples who would have at one point spoken some sort of Celtic language. So this would be the Irish, Scottish, Welsh, Bretons (people from Brittany in France), and some Spanish peoples. Basques are sometimes included in this group too.
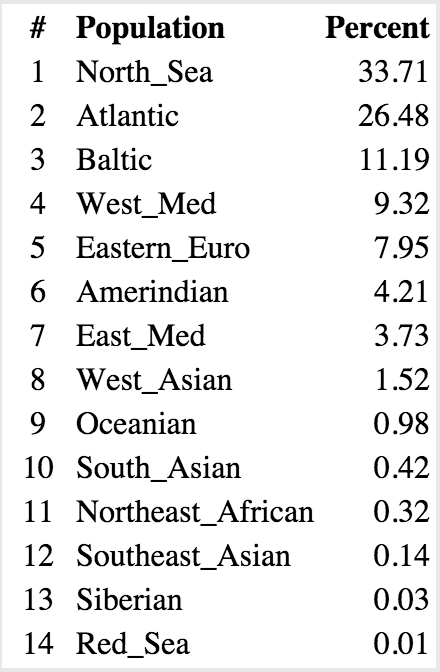
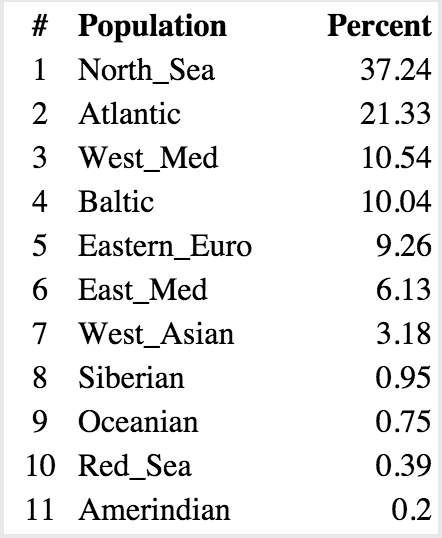
The actual numbers for these charts are below.
Casey:
Sharell:
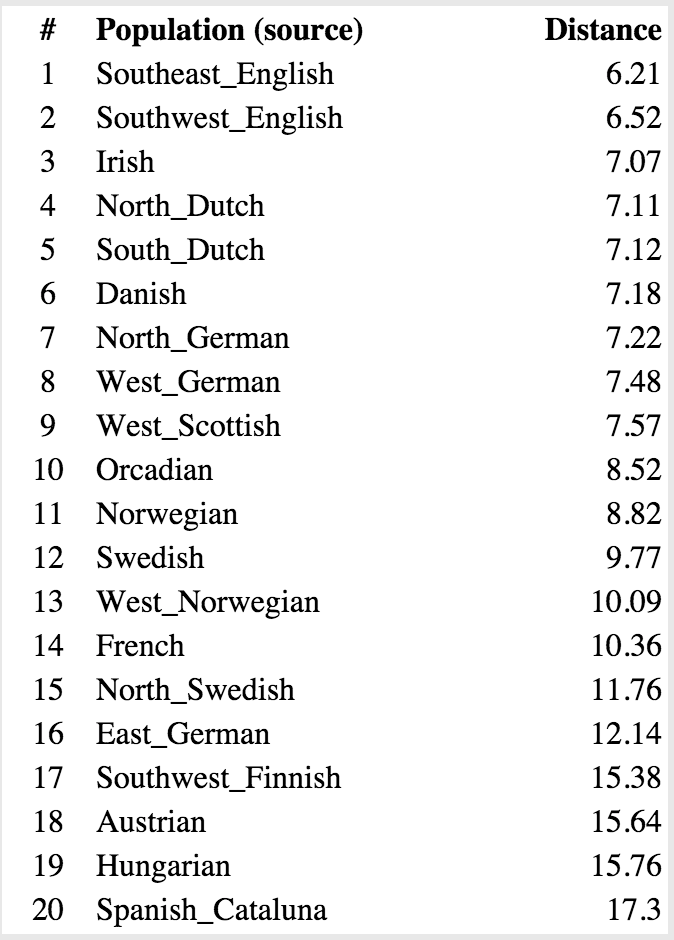
Though the raw genetic data can only be assigned to broad groups of people, you can get a little more specific by analyzing the patterns of this data. One way to do this is by least-squares analysis, where you arrive at probabilistic distances of an individual to the typical pattern of certain groups of people. What this means, is that a shorter calculated distance makes it more likely a person is from a given group. Here’s our data.
Casey:
Sharell:
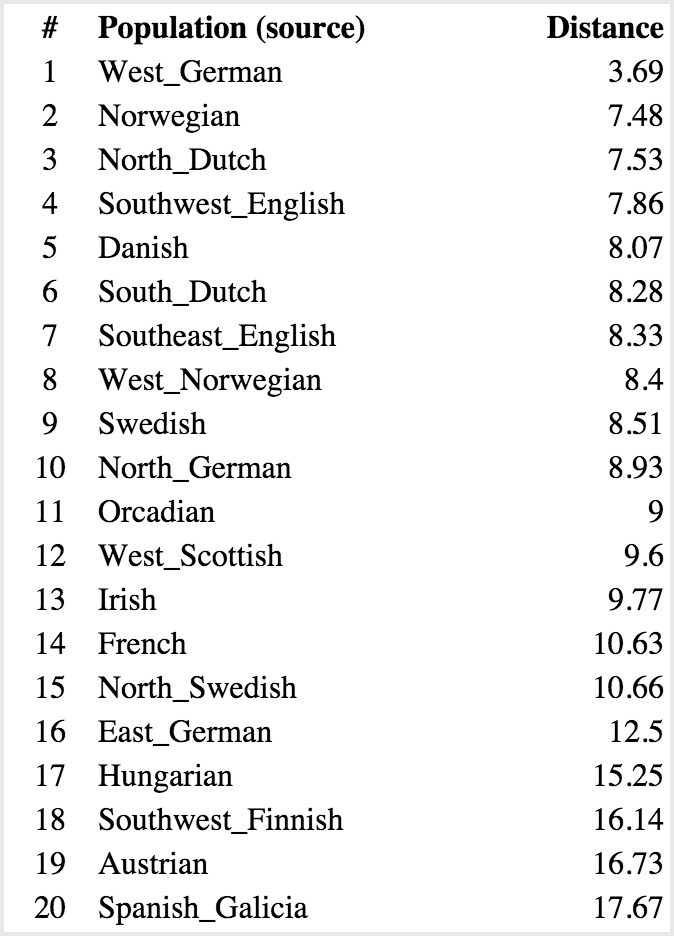
Of course, this above type of analysis is basically saying: “If I have to pick one group a person is part of, which do they fit in?” The problem is, most people’s backgrounds are not that homogenous. You can see the problem this method runs into by comparing my top result with Sharell’s–at 6.21 from Southeast English, I’m nearly twice as far as her distance to West German (3.69). This is probably due to the Native American ancestry I have mixed in there, making it harder to fit me into that Southeast English mold, while Sharell is from all European stock. So if you do a similar analysis, where instead you are measuring the probabilistic distance to pairs of backgrounds, you get something like this.
Casey:

Sharell:
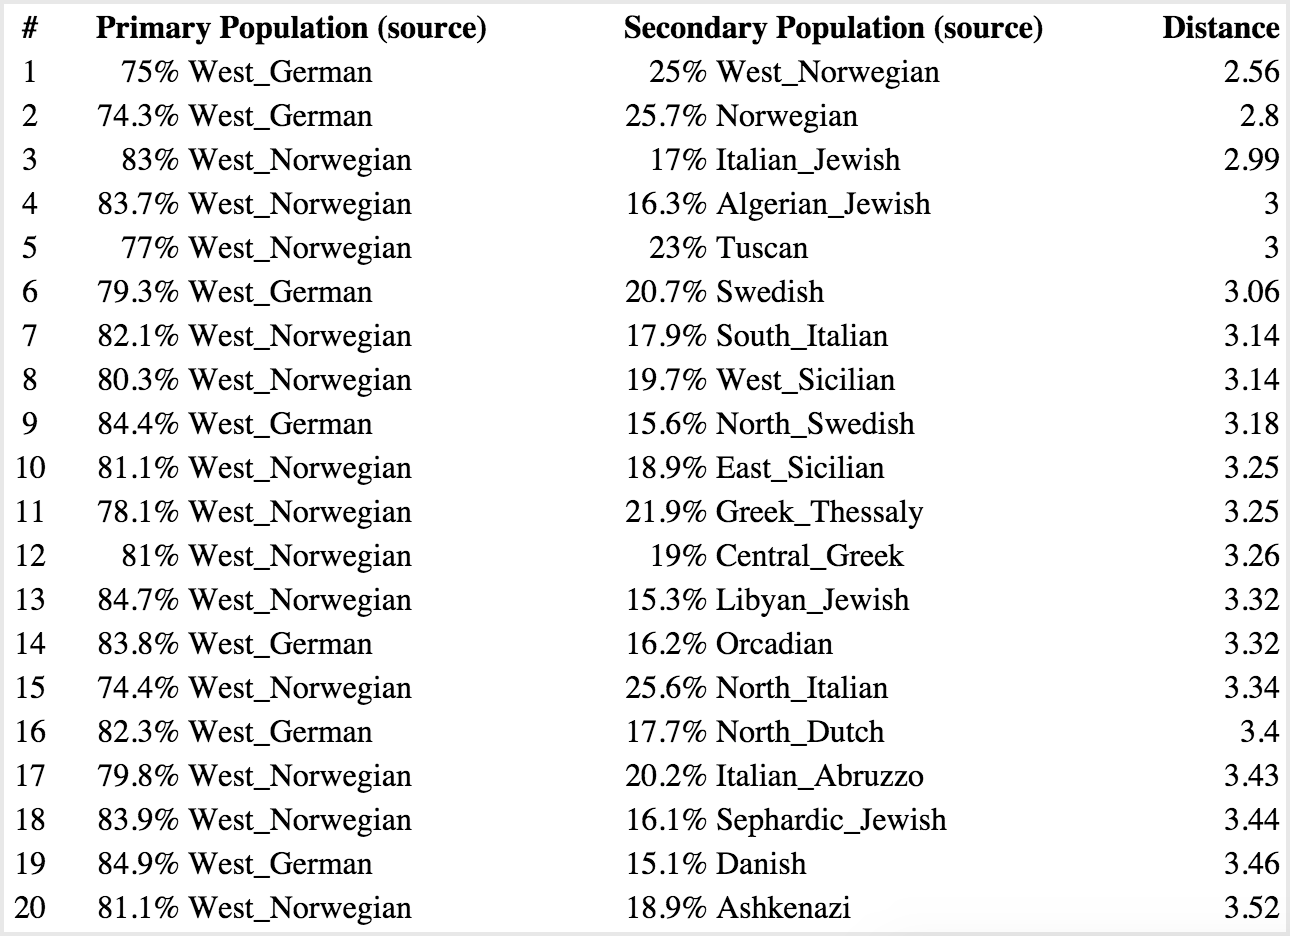
For my results, you can see that this brings my top match’s probabilistic distance much closer (3.21). Sharell’s is a mixture of German and Scandinavian, which is not surprising given what we know about her Danish ancestry (these countries border one another), and this is also probabilistically closer at 2.56.
Unfortunately these analyses can only tell us a certain amount about a person’s background, and are mainly useful in painting a picture with broad strokes. You also have to keep in mind what we actually know about a person’s genealogy when interpreting the data. For example, in my pie chart above, it indicates that I have ancestry from Oceania–unlikely. Instead, what appears to the analysis as being Oceanic is probably a Native American sequence that represents overlapping similarity between those groups.